Last Update: 23 Dec 2020
R Markdown:
DESeq2.Rmd
Differential Gene Expression analysis with DESeq2
There are many programs that you can use to perform differential
expression Some of the popular ones for RNA-seq are
DESeq2,edgeR,
or
QuasiSeq.
Here we will demonstrate differential expression using DESeq2 which
is usually cited as the following:
- Love, M.I., Huber, W. and Anders, S., 2014. Moderated estimation of fold change and dispersion for RNA-seq data with DESeq2. Genome biology, 15(12), p.550.
More Information
Installing DESeq2
These steps should be done either on RStudio or in R terminal (see tutorial on setting up an R and RStudio environment):
DESeq2 is available from Bioconductor (not on currently on CRAN).
1
2
3
4
5
6
7
## RNA-seq analysis with DESeq2
## Largely based on Stephen Turner, @genetics_blog
## https://gist.github.com/stephenturner/f60c1934405c127f09a6

source("http://bioconductor.org/biocLite.R")
biocLite("DESeq2")
library("DESeq2")
Overview
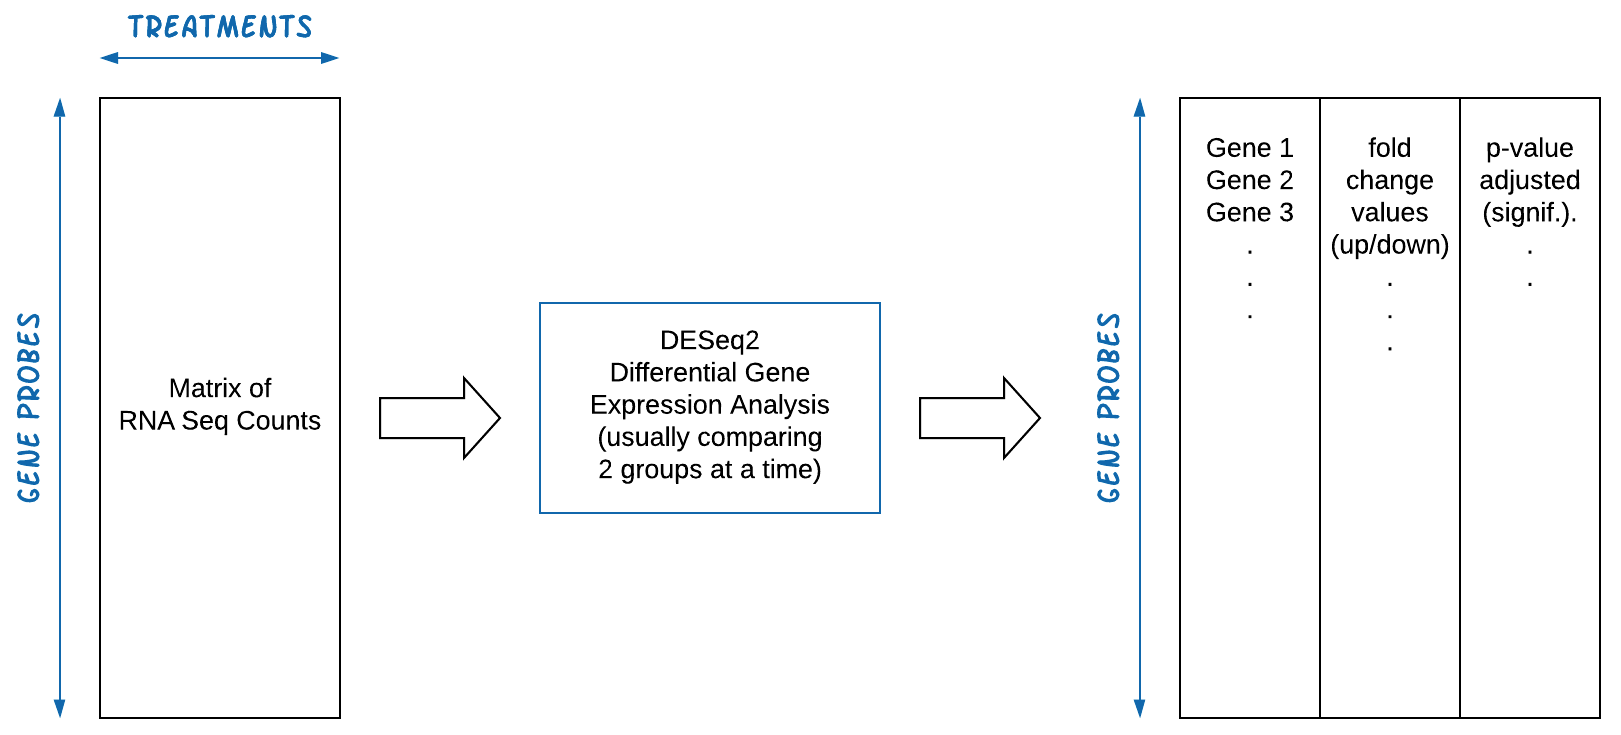
The DESeq2 pipeline is expecting an input matrix of RNA Sequence
counts, usually where rows = gene probes and columns =
treatments. These counts must be integers (not floats or doubles).
1
2
3
4
5
6
7
8
9
10
11
12
13
14
15
16
17
18
19
20
21
22
23
24
25
26
27
28
29
30
31
32
33
34
35
36
37
38
39
setwd("~/Atrx/")
dat <- read.table("At_count.txt", header = T, quote = "", row.names = 1)

# Convert to matrix
dat <- as.matrix(dat)
head(dat)

# Assign condition (first three are WT, next three are mutants)
condition <- factor(c(rep("WT",3), rep("Mut",3)))
condition = relevel(condition, ref = "WT")


# Create a coldata frame: its rows correspond to columns of dat (i.e., matrix representing the countData)
coldata <- data.frame( row.names = colnames(dat),
                       condition)

head(coldata)

#            condition
# S293        WT
# S294        WT
# S295        WT
# S296       Mut
# S297       Mut
# S298       Mut


##### DESEq pipeline, first the design and the next step, normalizing to model fitting
dds <- DESeqDataSetFromMatrix(countData = dat,
                              colData = coldata,
                              design=~ condition)


dds <- DESeq(dds)

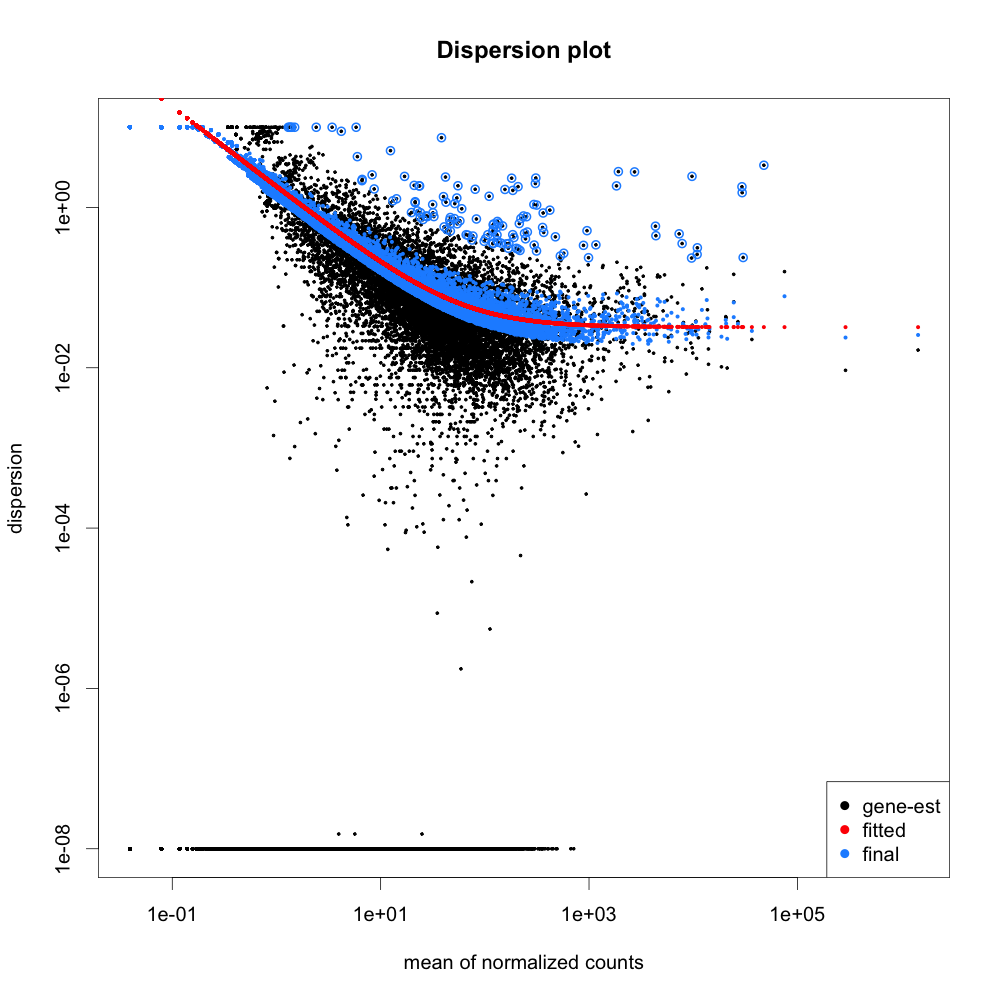
# Plot Dispersions:
png("qc-dispersions.png", 1000, 1000, pointsize=20)
plotDispEsts(dds, main = "Dispersion plot")
dev.off()
1
2
3
4
5
6
7
# Regularized log transformation for clustering/heatmaps, etc
rld <- rlogTransformation(dds)
head(assay(rld))
hist(assay(rld))

# Principal Components Analysis
plotpca(rld)

1
2
3
4
5
6
7
8
9
10
11
12
13
14
15
16
17
18
19
20
# Colors for plots below
## Ugly:
## (mycols <- 1:length(unique(condition)))
## Use RColorBrewer, better
library(RColorBrewer)
(mycols <- brewer.pal(8, "Dark2")[1:length(unique(condition))])

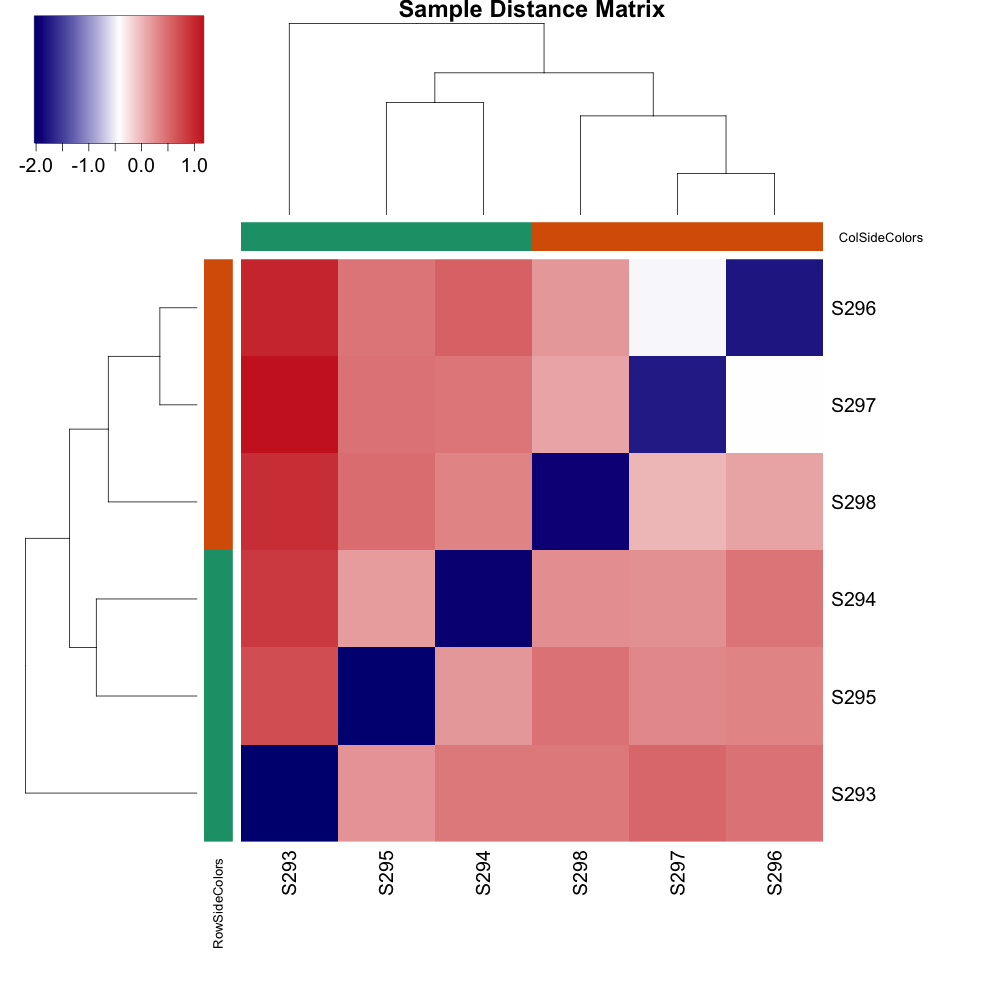
# Sample distance heatmap
sampleDists <- as.matrix(dist(t(assay(rld))))
library(gplots)
png("qc-heatmap-samples.png", w=1000, h=1000, pointsize=20)
heatmap.2(as.matrix(sampleDists),
          key = F,
          trace = "none",
          col = colorpanel(100, "black", "white"),
          ColSideColors = mycols[condition],
          RowSideColors = mycols[condition],
          margin = c(10, 10),
          main = "Sample Distance Matrix")
dev.off()
1
2
3
# Get differential expression results
res <- results(dds)
table(res$padj<0.05)
We observe 204 differentially expressed genes with adjusted p value <= 0.05
| FALSE | TRUE |
|---|---|
| 6712 | 204 |
1
2
3
4
5
6
7
8
9
10
11
12
13
## Order by adjusted p-value
res <- res[order(res$padj), ]

## Merge with normalized count data
resdata <- merge(as.data.frame(res),
                 as.data.frame(counts(dds, normalized = TRUE)),
                 by = "row.names",
                 sort = FALSE)
names(resdata)[1] <- "Gene"
head(resdata)

## Write results
write.csv(resdata, file = "diffexpr-results.csv", quote = FALSE, row.names = F)
To get the first few rows do head -4 diffexpr-results.csv
1
2
3
4
Gene,baseMean,log2FoldChange,lfcSE,stat,pvalue,padj,S293,S294,S295,S296,S297,S298
gene32459,4529.272154082,-2.06484914507321,0.288731491703117,-7.15145110390785,8.58653066559819e-13,5.93844460832771e-09,11073.6705141816,5726.45128024,5128.92211910988,1482.46794888894,1473.13299530101,2290.98806677055
gene38073,36575.3870282423,-1.38271999532283,0.199996648356586,-6.91371583816493,4.7212044436934e-12,1.63259249662918e-08,60993.4651420719,43969.9190693109,53655.982748808,21424.5919655829,22323.7590351868,17084.604208493
gene1446,62.2619789946306,-2.86730516347734,0.43036495871904,-6.66249680738816,2.69214169069523e-11,6.20628397761607e-08,186.819432107996,65.9054495168287,73.2220377206551,12.4735356867937,10.8379903446028,24.3134285909079
1
2
3
4
5
6
7
8
9
10
11
12
13
14
15
16
17
18
## Examine plot of p-values
hist(res$pvalue, breaks=50, col="grey")

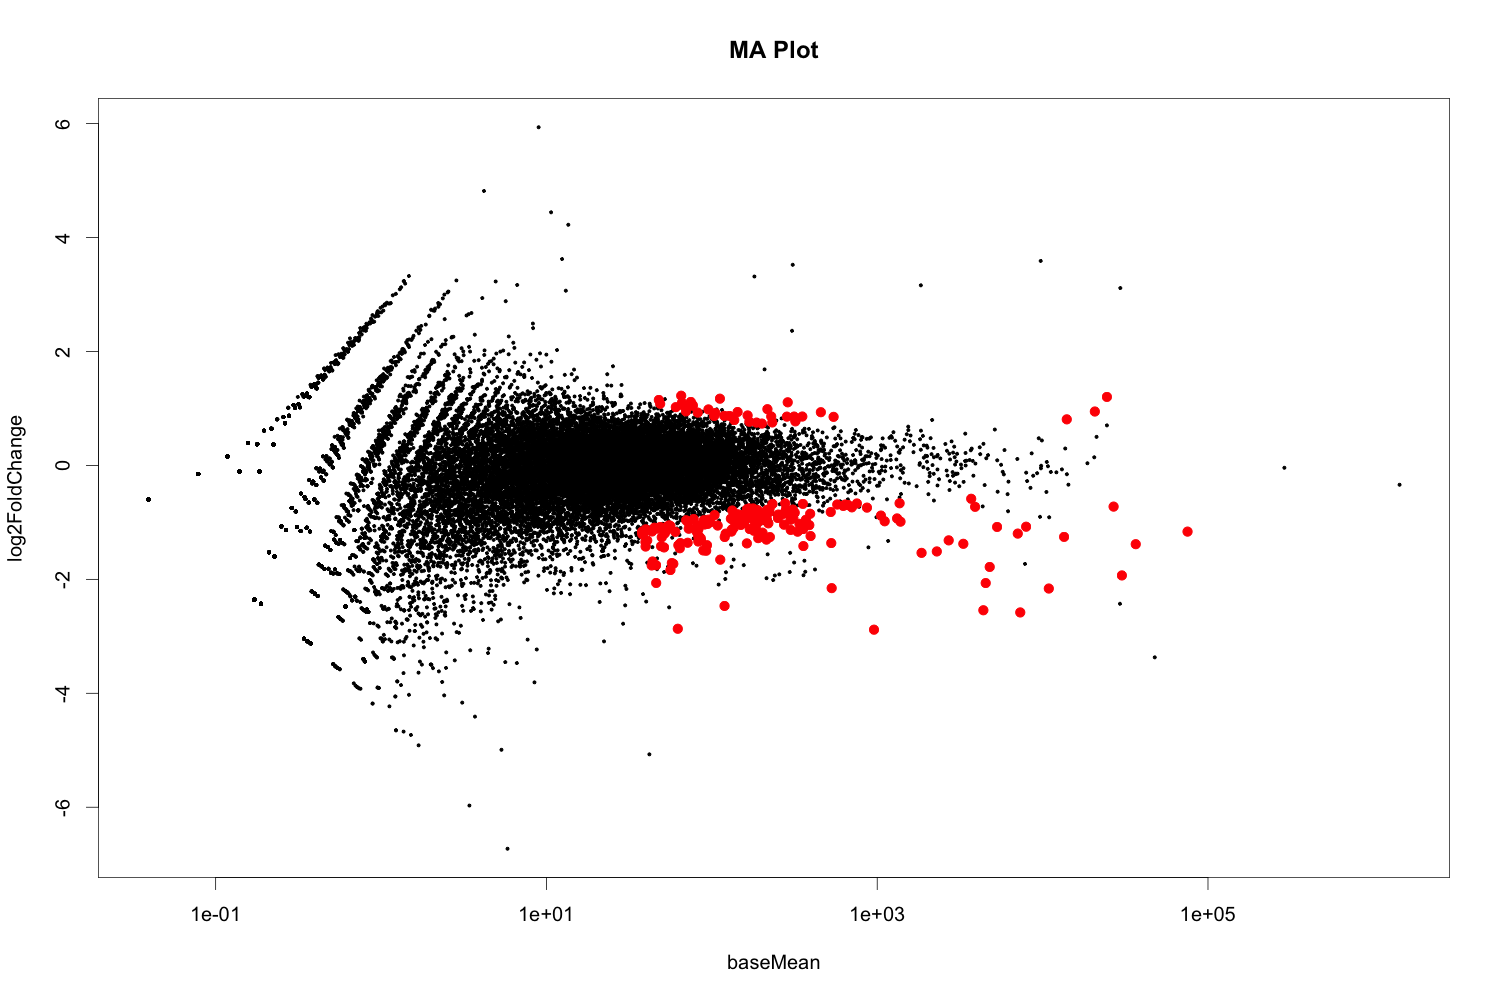
## MA plot
## Could do with built-in DESeq2 function:
## DESeq2::plotMA(dds, ylim=c(-1,1), cex=1)
## This is Stephen Turner's code:
maplot <- function (res, thresh=0.05, labelsig=TRUE, textcx=1, ...) {
  with(res, plot(baseMean, log2FoldChange, pch=20, cex=.5, log="x", ...))
  with(subset(res, padj<thresh), points(baseMean, log2FoldChange, col="red", pch=20, cex=1.5))
  if (labelsig) {
    require(calibrate)
    with(subset(res, padj<thresh), points(baseMean, log2FoldChange, labs=Gene, cex=textcx, col=2))
  }
}
png("diffexpr-maplot.png", 1500, 1000, pointsize=20)
maplot(resdata, main="MA Plot")
dev.off()
1
2
3
4
5
6
7
8
9
10
11
12
13
14
15
16
17
## Plots to Examine Results:

## Volcano plot with "significant" genes labeled
volcanoplot <- function (res, lfcthresh=2, sigthresh=0.05, main="Volcano Plot", legendpos="bottomright", labelsig=TRUE, textcx=1, ...) {
  with(res, plot(log2FoldChange, -log10(pvalue), pch=20, main=main, ...))
  with(subset(res, padj<sigthresh ), points(log2FoldChange, -log10(pvalue), pch=20, col="red", ...))
  with(subset(res, abs(log2FoldChange)>lfcthresh), points(log2FoldChange, -log10(pvalue), pch=20, col="orange", ...))
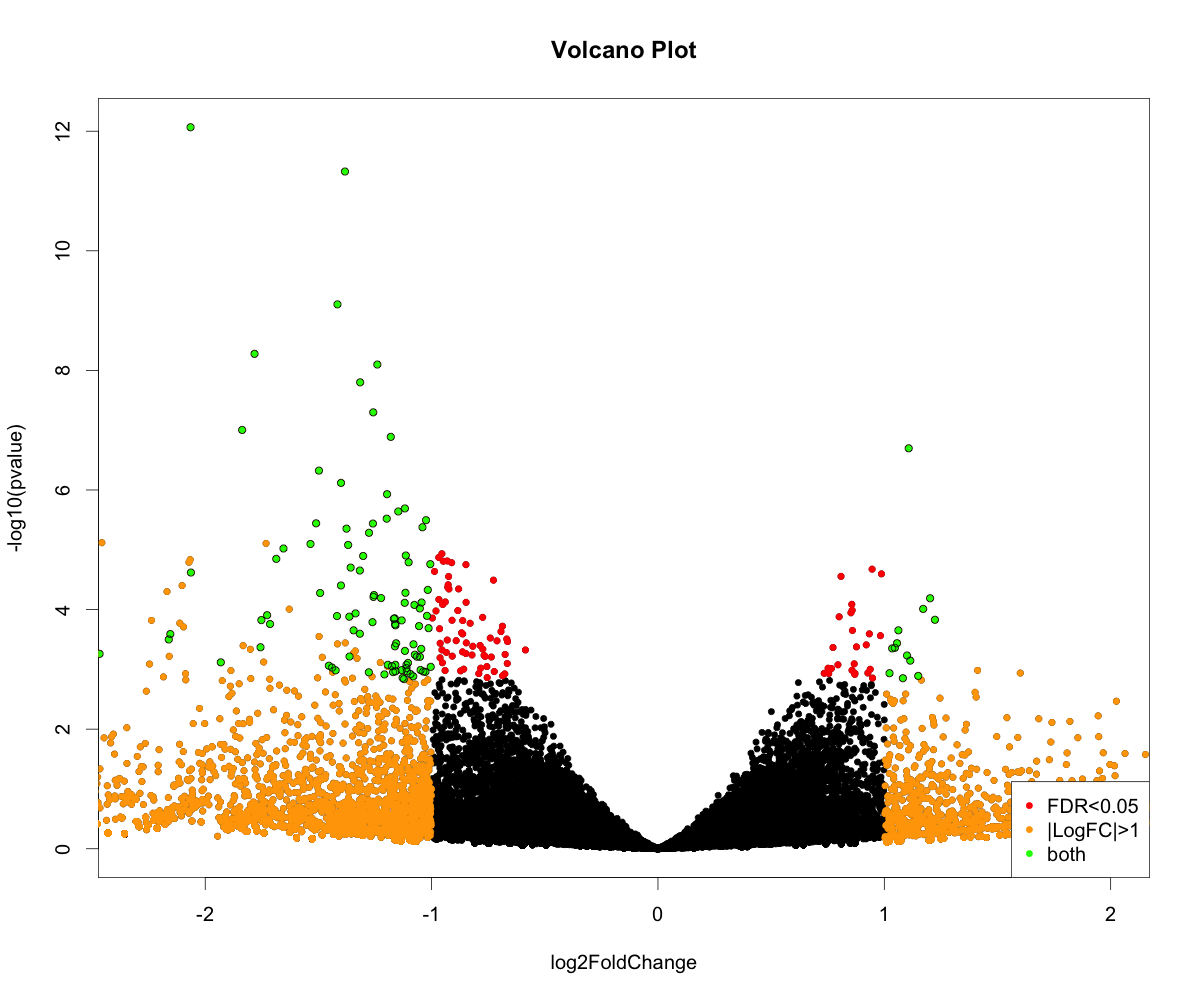
  with(subset(res, padj<sigthresh & abs(log2FoldChange)>lfcthresh), points(log2FoldChange, -log10(pvalue), pch=20, col="green", ...))
  if (labelsig) {
    require(calibrate)
    with(subset(res, padj<sigthresh & abs(log2FoldChange)>lfcthresh), points(log2FoldChange, -log10(pvalue), labs=Gene, cex=textcx, ...))
  }
  legend(legendpos, xjust=1, yjust=1, legend=c(paste("FDR<",sigthresh,sep=""), paste("|LogFC|>",lfcthresh,sep=""), "both"), pch=20, col=c("red","orange","green"))
}
png("diffexpr-volcanoplot.png", 1200, 1000, pointsize=20)
volcanoplot(resdata, lfcthresh=1, sigthresh=0.05, textcx=.8, xlim=c(-2.3, 2))
dev.off()
